A detour from concentration on arable land to the miscellaneous, or other, land is justified to see if humanity's urban uses threaten Nature or agriculture's ability to spare land. Seeing what they have wrought, dwellers in the suburbs and commuters to the cities naturally fear the encroachment of urban use on arable land, which forces farmers to plow elsewhere, sparing less for Nature. The fear is sensible. Most inland cities grew near water and land that could feed them. Because the Industrial Revolution demanded concentrations of people, the cities grew and expanded.
In the United States, at least, productive agricultural land surrounds cities, which they expand into. Greater than 60% of the land removed from agriculture comes from cropland, and 90% of the cropland likely to be converted to other uses in 50 years is expected to be prime farmland (U.S. Department of Agriculture, 1990,[USD90a] 20).
A logical forecast of the sprawl of urban into crop uses could begin with the ratio of people to urban use today and multiply the ratio by the projected growth of population. The trouble begins immediately with the question, ``How much of other is urban use now?" Neither the United Nations nor the WRI venture an estimate.
Crosson and Anderson (1992[CA92]) cite Buringh's estimate of 400 million `non agricultural' ha in the world in 1982. They point out that 400 million is too large because it implies a world average of 0.18 ha/urban dweller, a figure far exceeding the actual 0.013 in Buenos Aires and 0.002 in Lagos. Crosson and Anderson conclude that city data showing urban land/urban person are more reliable than a global estimate. They go on to cite hectare/dweller of 0.08 for all Pakistan but 0.008 for Karachi.
Higgins et al. (1982[HKN![]() 82])
82])![]() cite other hectare/person
without explaining whether they divide by total or
urban population. They projected the nonagricultural
use of land by multiplying the rise in population by
0.05 ha/ca. A tabulation of numbers they cite, however,
suggests that the urban land/capita goes down
as the density of population goes up.
cite other hectare/person
without explaining whether they divide by total or
urban population. They projected the nonagricultural
use of land by multiplying the rise in population by
0.05 ha/ca. A tabulation of numbers they cite, however,
suggests that the urban land/capita goes down
as the density of population goes up.
Other evidence that Higgins et al. cite suggests that urban use may not rise linearly with population: The increase of Bangladesh's population between 1952 and 1974 was absorbed in existing urban regions, conserving adjacent land and lowering urban use from 0.027 to 0.018 ha/ca.
Frink (1992[Fri92]) analyzed the 1.3 million ha of Connecticut in detail (see Figure 4.2.1). In Connecticut, where about one-third of the New England population lives, the 0.06 ha urban land/ca is the same as for the whole United States and is considerably smaller than the 0.25 for all New England.
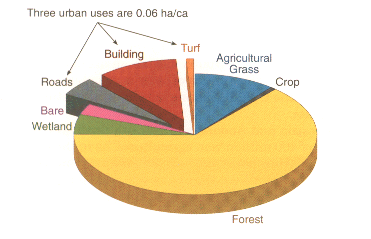 Figure 4.2.1. Land use in Connecticut (Fink, 1992).[Fri92]
The Second RCA Appraisal (U.S. Department of Agriculture, 1990, 18-20[USD90a]) discusses the difficulties of defining urban uses and illustrates how even the same organization makes different estimates. The Appraisal's most likely estimates of land converted to urban uses are in its Figure 10. The land converted per increase in U.S. population was 0.16 ha/ca from 1958 to 1968, rose to 0.43 from 1968 to 1977, and fell back to 0.16 from 1977 to 1982. Not surprisingly, suburbanization occupied land faster than had the old settlement that produced the average of 0.06 ha/ca. Nevertheless, by 1977-1982 the ratio declined. If the increments of urban land since 1982 were known, I might find that the era of condominiums slowed the conversion/person even more.
In 1970, density of all population
per all land in
the 18 water resource regions of the United States
ranged from 0.01 to 1.5 persons/ha (Spaulding and
Heady, 1977[SH77]). To extend the range of the sample, I
added Connecticut with 2.6 and Bangladesh
with 4.7
persons/ha. Anticipating a smaller fraction of land
used for urban purposes as the population becomes
denser, I plotted the fraction of land in urban use
versus the density of population
on logarithmic coordinates
(Figure 4.2.2.).
The best fitting equation is
![]()
where Density is persons/hectare of all land. The exponent
0.866, which is significantly smaller than 1,
shows the expected curvature. The equation underestimates
the urban use in New England and even
Connecticut and overestimates the use in Bangladesh
and the mid-Atlantic region of the United States. The
missed estimates seem large on a graph with arithmetic coordinates,
and one can only guess how highways, suburbanization,
or simply varying definitions
of urban use might cause them. Nevertheless, a decreasing
rate of using land for urban purposes as population
density rises fits the points in Figure 4.2.2 better
than does a ratio of 0.05 ha/ca. Most important
perhaps, less urban use per capita when population
is denser makes sense. Estimated at the decreasing
rate, 5.3 billion people today use 280 million ha (Mha)
for urban purposes. This area is encompassed in but
is much smaller than the 4,206 Mha classified as other
uses by FAO and shown in Figure 4.1.1.
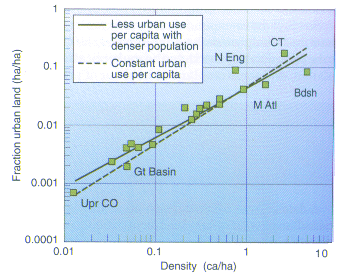 Figure 4.2.2. How increasing population density in a region
raises the fraction of land used for urban purposes.
The dotted line shows how the fraction would rise
if a constant 0.05 ha were used per capita regardless
of population density. The solid line shows instead
declining urban use per capita as population grows
denser; the decline is represented by a
proportionality between urban use and Density
raised to the 0.866 power. The points represent the
18 water resource regions of the United States in
1970 as described by Spaulding and Heady (1977).
I identify the New England (N Eng), mid-Atlantic (M
Atl), Great Basin (GT Basin), and Upper Colorado
(Upr CO) regions. To extend the range of densities,
I added Connecticut (CT) and Bangladesh (Bdsh)
(adapted from Spaulding and Heady, 1977).[SH77]
Figure 4.2.2. How increasing population density in a region
raises the fraction of land used for urban purposes.
The dotted line shows how the fraction would rise
if a constant 0.05 ha were used per capita regardless
of population density. The solid line shows instead
declining urban use per capita as population grows
denser; the decline is represented by a
proportionality between urban use and Density
raised to the 0.866 power. The points represent the
18 water resource regions of the United States in
1970 as described by Spaulding and Heady (1977).
I identify the New England (N Eng), mid-Atlantic (M
Atl), Great Basin (GT Basin), and Upper Colorado
(Upr CO) regions. To extend the range of densities,
I added Connecticut (CT) and Bangladesh (Bdsh)
(adapted from Spaulding and Heady, 1977).[SH77]
Whether I estimate urban use by the future 10 billion people by one rule or another on Figure 4.2.2 makes little difference if I use the average global density of 10 billion people divided by 13 billion ha. Alternatively, I can calculate urban use by the future 10 billion at some actual rates: Imagine 5 billion at the Bangladesh rate of 0.018 ha/ca, 4 billion at the mid-Atlantic rate of 0.032 and 1 billion at the northern Pacific rate of 0.053. Urban use calculated in this fashion falls one-quarter billion ha and nearly 50% lower than the use calculated at 0.05 ha/ca over all. Clearly settling how much land people will use for urban purposes is not merely academic.
For now, however, I shall take the pessimistic course of asking whether the larger estimate of one-half billion ha will materially affect the area that can be spared for Nature. A future urban use near one-half billion ha remains considerably smaller than the present other uses. Although the increase of 210 Mha from 280 to 490 Mha in urban use is one-seventh of present permanent crops and arable land, it is less than 2% of the world's land. Some conversion to urban use will come from the 89% of land that is not today cropland.
So I conclude for the world what Crosson and Anderson (1992[CA92]) concluded for less developed countries: ``The conversion of land to urban and built-up uses over the next several decades is not likely to seriously diminish the supply of land for agricultural production." I conclude that the displacement of farming by urban uses will affect how much ten-billion people can spare for Nature--little.