


Next: Introduction
Up: How Much Land Can
Previous: Abbreviations
- If people keep on eating and multiplying and
farmers keep on tilling and harvesting as today,
the imperative of food will take another tenth of
the land, much from Nature. So farmers work at
the hub of sparing land for Nature.
- Calories and protein from present cropland would
give a vegetarian diet
to ten billion. A diet requiring
food and feed totaling 10,000 calories for ten
billion, however, obviously would exceed the capability
of present agriculture on present cropland.
- global totals of sun
on land, CO
 in the air,
fertilizer,
and even water
could produce far more
food than ten billion need.
in the air,
fertilizer,
and even water
could produce far more
food than ten billion need.
- By eating different species of crop and more or less
vegetarian diets people can change the number
who can be fed from a plot. And large numbers of
people do change diets.
- Encouraged by incentives,
farmers
use new technologies
to raise more crop per plot and more meat
and milk per crop, keeping food prices down despite
rising population.
Differences in yields
among nations and between average and master
farmers continue showing that yields can be
raised more.
- Foreseeing the future demands seeing through
fluctuations
in crop production.
- For each ton of production, growing more food per
plot lessens the fallout,
for instance, of silt and
pesticides, into the surroundings. If several limiting
factors are improved together, even adding
water and fertilizer can diminish fallout.
- Although the uneven distribution of water among
regions and its capricious variation among seasons
plague farming, opportunities to raise more crop
with the same volume of water kindle hope.
- In Europe and the United States, rising income,
improving technology,
and leveling populations--which
all nations aspire to--elicit forecasts of shrinking cropland.
- So by harvesting more per plot, farmers can help
ten billion spare some land
that unchanging yields
would require to feed them. Glimmers can be seen
even of changing diets,
never-ending research,
encouraging incentives, and smart farmers feeding
ten billion at affordable prices while sparing
some of today's cropland for Nature.
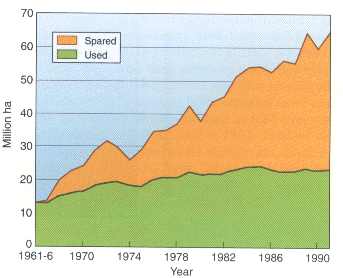
Figure S-1. The land that Indian farmers spared by raising wheat
yields. The upper curve shows the area that they
would have harvested at 1961-1966 yields to grow
what they produced. The lower curve shows the area
that they actually harvested. They spared the
difference. The figure extends a table compiled by
Borlaug (1987).[Bor87]
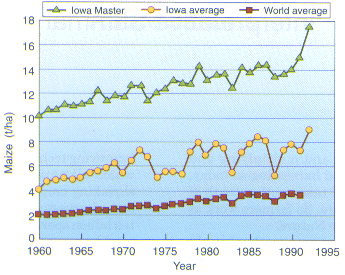
Figure S-2. Annually since 1960, the farmers of the world lifted average
corn yields 0.06 t/ha. In the Tall corn State, Iowa farmers lifted
their average 0.10. And winners of the Iowa Master corn
Growers' contest stayed ahead, pushing up winning yields 0.14.
So far, rising averages continue sparing land, and the persisting
gap between averages and winners sustains hope for future sparing.
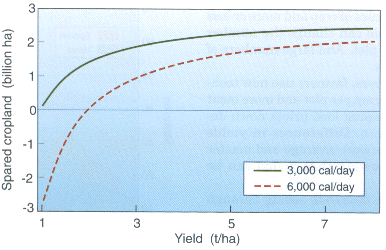
Figure S-3. Sparing part of 2.8 billion ha as farmers raise yields and
ten billion people each account for 3,000 or 6,000 calories daily. The
2.8 is twice the present cropland as ten billion is roughly twice
the present population. On the left of the graph at a yield of
1 t/ha, people accounting for 3,000 would spare none, and for
6,000 would take more than 2.8, a negative sparing. Near the
middle, a yield of 4 t/ha would spare much of the 2.8 billion ha.
If farmers lifted yields to 6 t/ha on the right, they would spare
a bit of today's cropland, even if each of the ten billion accounted
for 6,000 calories daily.
Next: Introduction
Up: How Much Land Can
Previous: Abbreviations
Yasuko Kitajima
Thu Jun 19 16:20:56 PDT 1997